
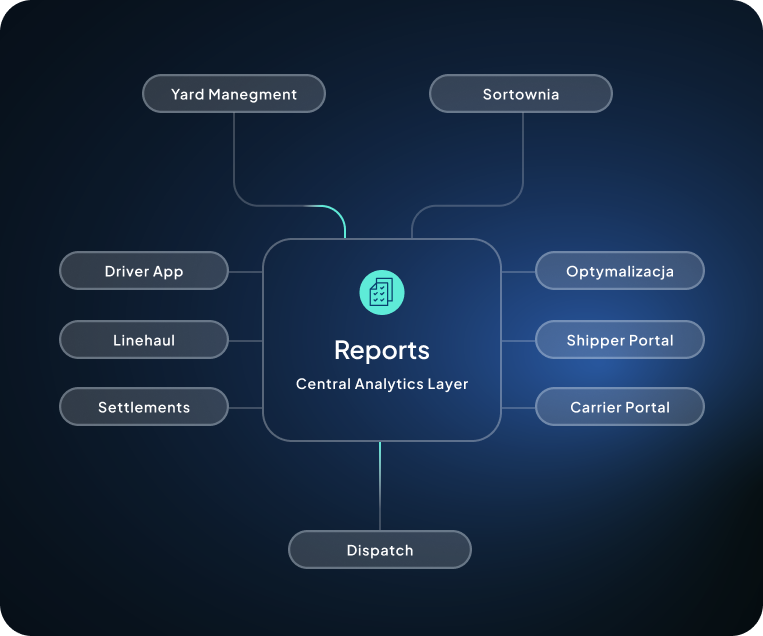
 Control Room
Source of order-fulfilment and exception-handling data
Reports
&UP® Reports brings together operational and financial information from the platform’s other modules. Each team is granted access to data at the appropriate level of detail, ranging from day-to-day operational monitoring to an analysis of the organisation’s overall performance.








A view of key operational indicators updated in real time. Each role within the organisation has access to its own dashboard with the appropriate level of detail:
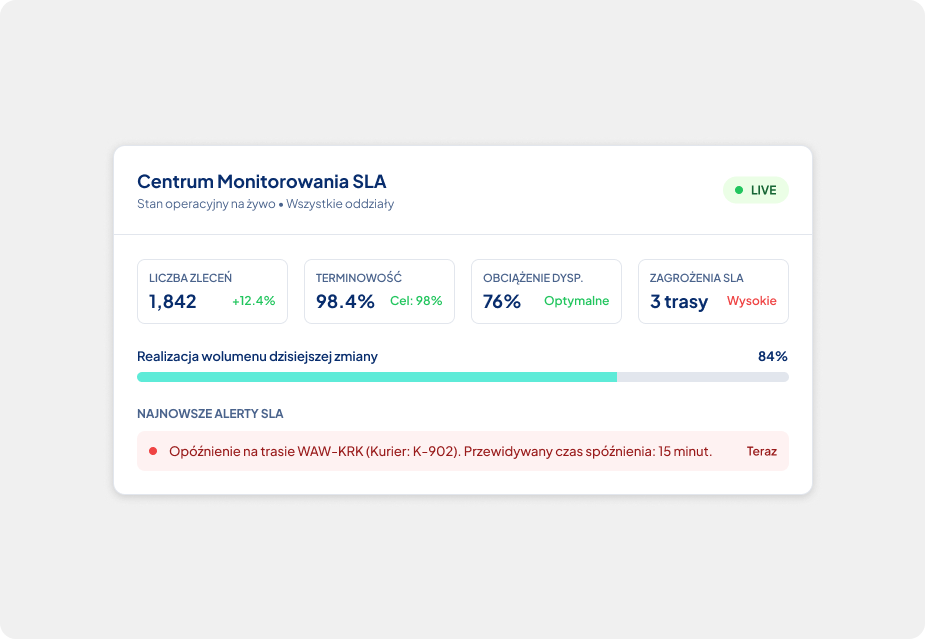
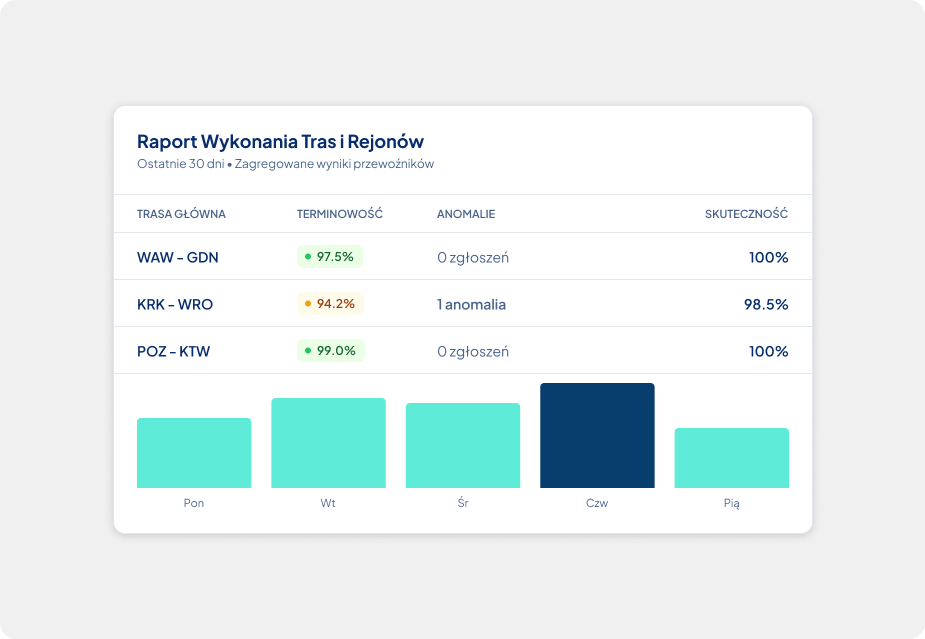
Detailed operational performance reports covering the completion of journeys, delivery punctuality, the handling of exceptions and branch activity. The reports are available for any time period: day, week, month or year.
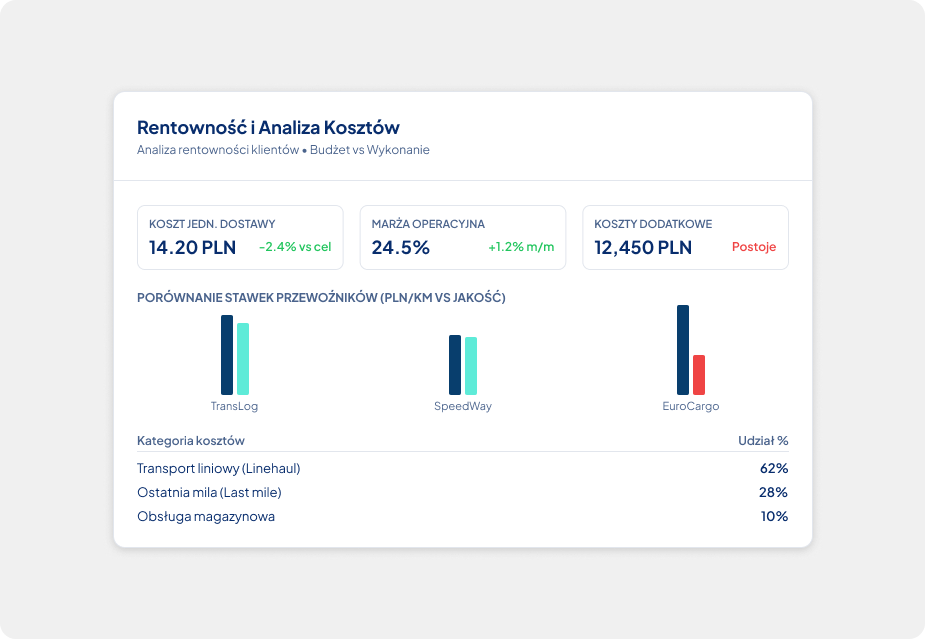
A comprehensive financial overview of operations includes the unit cost of delivery, customer profitability and the profitability of individual transport routes. Financial data is cross-referenced with operational data, which provides a better understanding of the reasons for deviations from the budget.
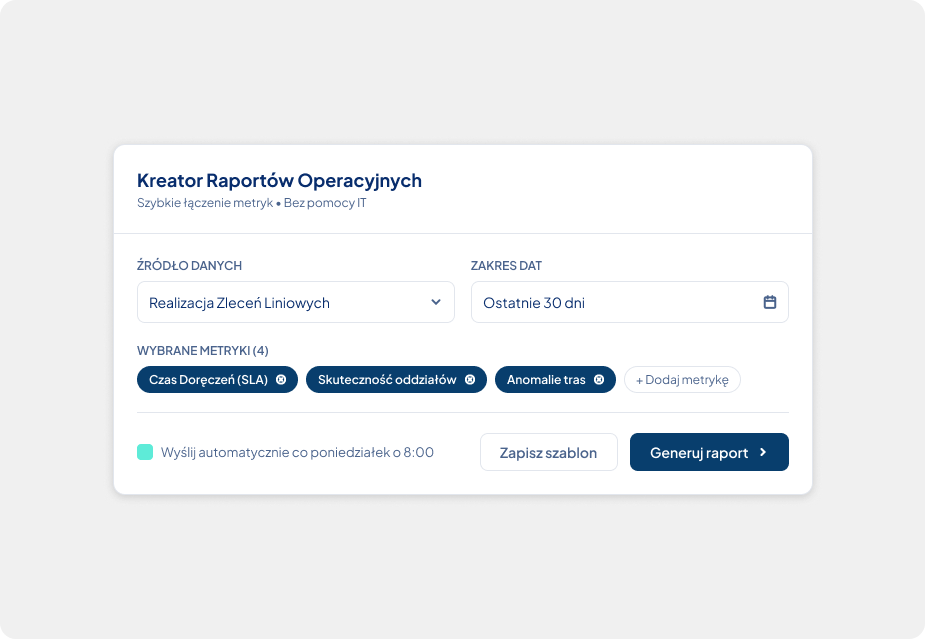
A tool enabling authorised users to create their own reports without involving the IT team. The module allows data from various areas to be combined into a single report in line with business needs:
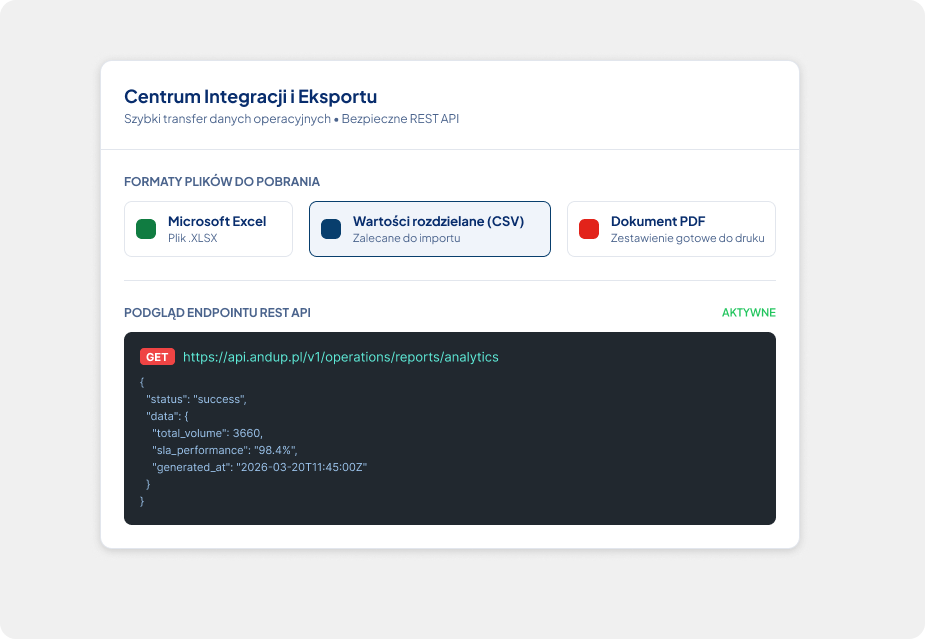
The module’s open architecture allows data to be transferred to external analytics tools, BI systems and spreadsheets.
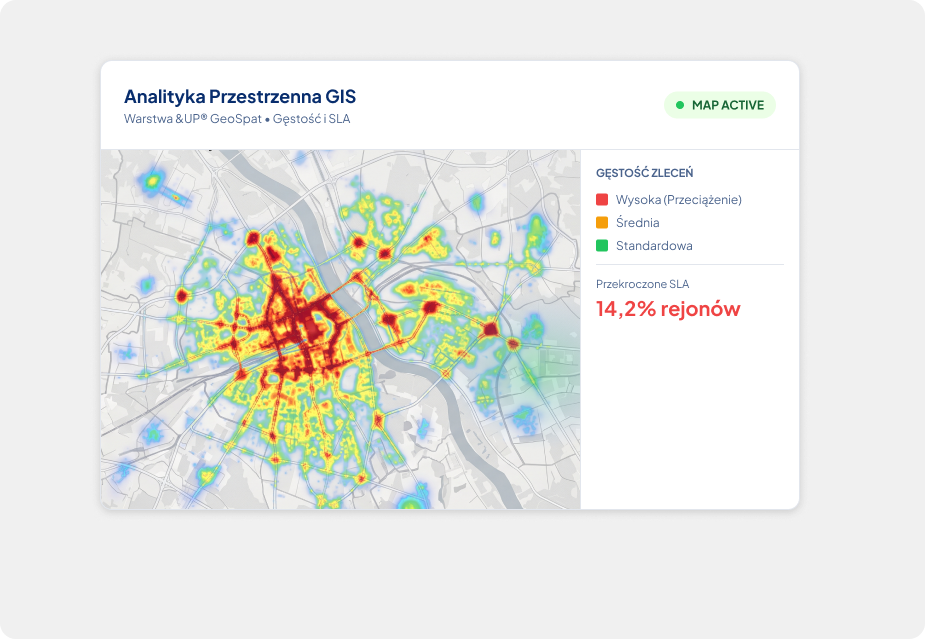
Geographical visualisation of operational data, based on the &UP® platform’s GIS layer. It enables management to analyse operations from a spatial perspective, showing customer locations, the distribution of volumes and areas requiring attention.
During a free consultation, we’ll show you how &UP® can help streamline selected areas of your operations.
Book a consultation
Live dashboards replace the reports that used to be prepared manually once a week.

The dispatcher, the manager and the board are all looking at the same data, each from their own perspective.

Data on service quality and punctuality are available to inform commercial discussions.

Exporting to Excel and BI breaks down the barriers between operations and the finance department.
Real-time
access to operational KPIs rather than weekly reports
–60 per cent
the time taken to prepare management reports
100 per cent
data consistency across the platform’s modules
Full
operational data history for any period
The Reports module collects data from all the platform’s operational modules.
This enables it to analyse the entire supply chain within a single context, rather than the fragmented views seen by individual teams. This is what sets the &UP® platform apart from single-module solutions, where analytics for each area operate separately.
See what the workflow looks like.
Operational data is fed automatically into the module from the other modules of the &UP® platform in real time.
Predefined dashboards and reports are available immediately upon implementation, with no configuration required.
Authorised users create their own reports and templates in line with business needs.
The data is exported to Excel, BI systems or ERP systems, or made available via an API.